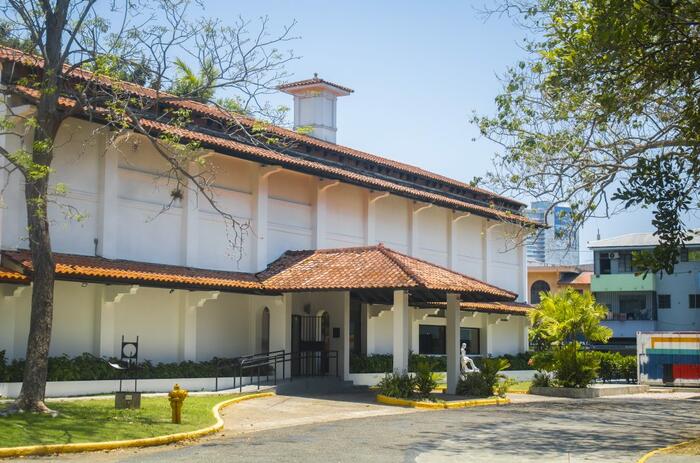
Notes related to MAC Panamá
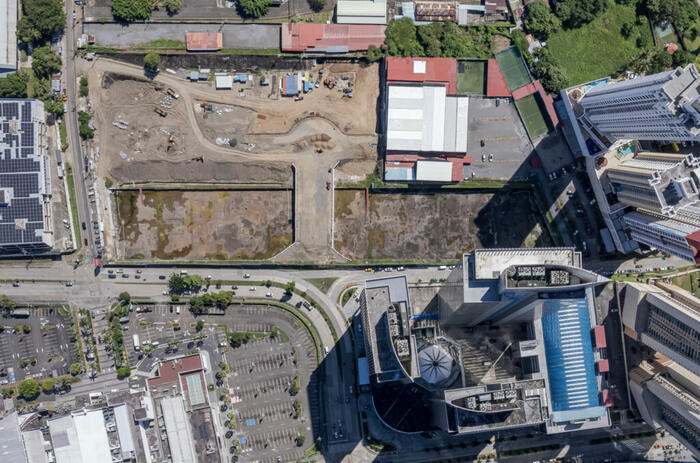
JUAN CANELA AT MAC PANAMÁ: A COLLABORATIVE, CONTEXTUAL CURATORIAL APPROACH

MAC Panamá's Chief Curator Juan Canela, reflects on the challenges of curating in Central America, the value of collaborative practices, and the context of Panamanian art. He is participating in the inaugural Pinta Panamá Art Week, running May 21–25 with activities centered on the local art scene.
Interviews

JUAN CANELA AT MAC PANAMÁ: A COLLABORATIVE, CONTEXTUAL CURATORIAL APPROACH

MAC Panamá's Chief Curator Juan Canela, reflects on the challenges of curating in Central America, the value of collaborative practices, and the context of Panamanian art. He is participating in the inaugural Pinta Panamá Art Week, running May 21–25 with activities centered on the local art scene.

CÚMULUS: TEN YEARS OF ECOLOGY AND COLLABORATION IN PANAMA

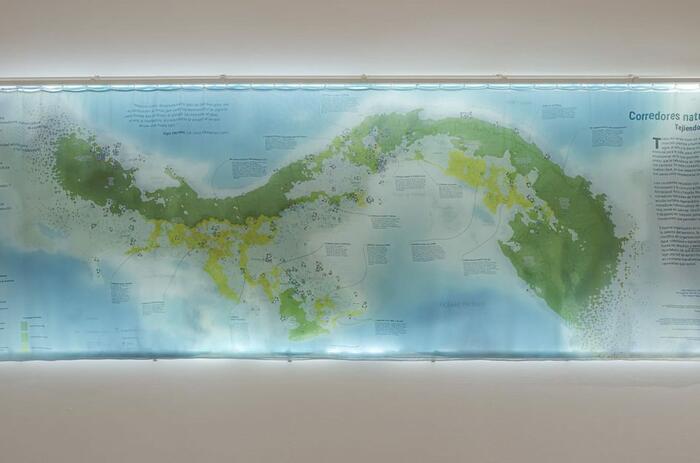
The Panarte gallery at the Museum of Contemporary Art of Panama hosts Cúmulus: 10+ Years of Estudio Nuboso, an exhibition celebrating over a decade of collaborative practices at the crossroads of art, science, and ecology.

News

CÚMULUS: TEN YEARS OF ECOLOGY AND COLLABORATION IN PANAMA

The Panarte gallery at the Museum of Contemporary Art of Panama hosts Cúmulus: 10+ Years of Estudio Nuboso, an exhibition celebrating over a decade of collaborative practices at the crossroads of art, science, and ecology.

eZ debug

Timing: Jan 28 2026 13:24:41
Script start
Timing: Jan 28 2026 13:24:41
Module start 'content'
Timing: Jan 28 2026 13:24:41
Module end 'content'
Notice: PHP: E_NOTICE Jan 28 2026 13:24:41
Array to string conversion in /var/www/sites/cms4/ez-2013.09/var/artealdia_com/cache/template/compiled/page_head-41456490553c6342610ca0a1b2d2cc7c.php on line 939
Timing: Jan 28 2026 13:24:41
Script end

Main resources:

Total runtime0.1415 sec
Peak memory usage5,120.0000 KB
Database Queries126

Timing points:

CheckpointStart (sec)Duration (sec)Memory at start (KB)Memory used (KB)
Script start 0.00000.0059 912.7422607.4766
Module start 'content' 0.00590.0985 1,520.21882,570.6953
Module end 'content' 0.10440.0370 4,090.9141405.6719
Script end 0.1414  4,496.5859 

Time accumulators:

 Accumulator Duration (sec) Duration (%) Count Average (sec)
Ini load
Load cache0.00302.0853170.0002
Mysql Total
Database connection0.00080.570910.0008
Mysqli_queries0.051436.28891260.0004
Looping result0.00181.26841260.0000
TS translator
TS init0.00130.934830.0004
TS cache load0.00100.700330.0003
TS context load0.00080.593030.0003
Template Total0.110077.720.0550
Template load0.00171.222420.0009
Template processing0.108376.501720.0541
Template load and register function0.00010.054410.0001
states
state_id_array0.00211.472180.0003
state_identifier_array0.00231.593090.0003
Override
Cache load0.00100.6818150.0001
Sytem overhead
Fetch class attribute can translate value0.00040.307550.0001
Fetch class attribute name0.00221.578750.0004
XML
Image XML parsing0.00997.017350.0020
class_abstraction
Instantiating content class attribute0.00000.034770.0000
General
dbfile0.014210.0472370.0004
String conversion0.00000.007120.0000
Note: percentages do not add up to 100% because some accumulators overlap

Time used to render debug report: 0.0003 secs